Corporate Credit Spread and VIX Correlation
Here we examine the correlation between equity volatility[i] and the corporate credit spread[ii]. Due to this relationship, T+ uses a small allocation to limited risk volatility securities[iii] to produce a return stream similar to corporate bonds[iv], with superior return attributes.
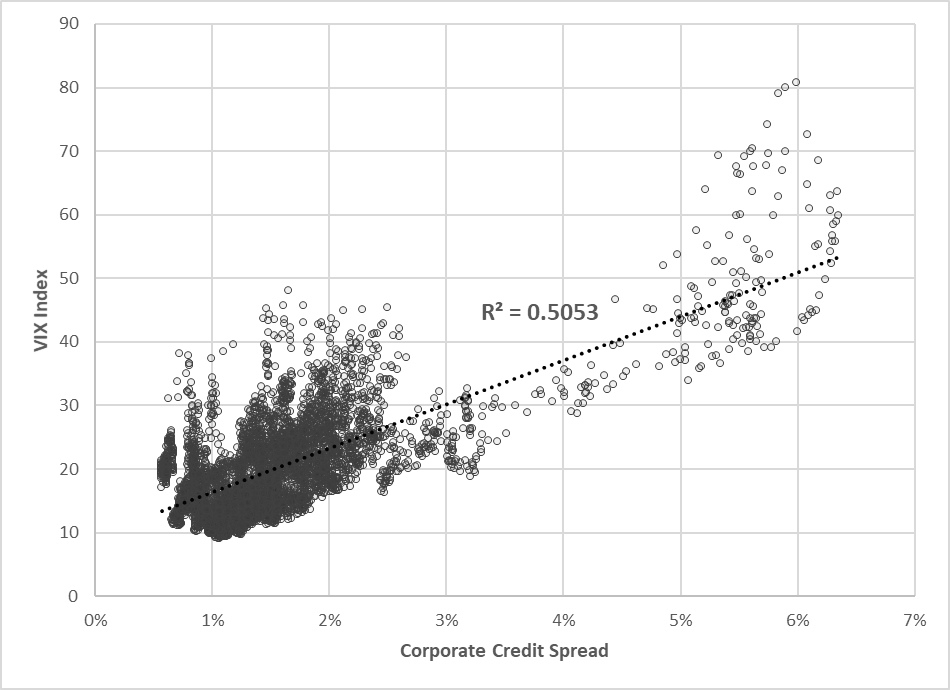
From January 1997 (Creation of spot VIX) through August 2018, the correlation of VIX to the Corporate Spread is around 0.505 with an extremely low (good) p-value, meaning the correlation is highly statistically significant.
|
Coefficients: Estimate Std. Error t value Pr(>|t|) (Intercept) 0.0897019 0.0215060 4.171 3.08e-05 *** Data$VIX 0.0729120 0.0009801 74.395 < 2e-16 *** --- Signif. codes: 0 ‘***’ 0.001 ‘**’ 0.01 ‘*’ 0.05 ‘.’ 0.1 ‘ ’ 1 Residual standard error: 0.6041 on 5423 degrees of freedom Multiple R-squared: 0.5051, Adjusted R-squared: 0.505 F-statistic: 5535 on 1 and 5423 DF, p-value: < 2.2e-16 |
In the scatter plot below, you can see that when the credit spread increases, usually due to market stress, VIX is also elevated.
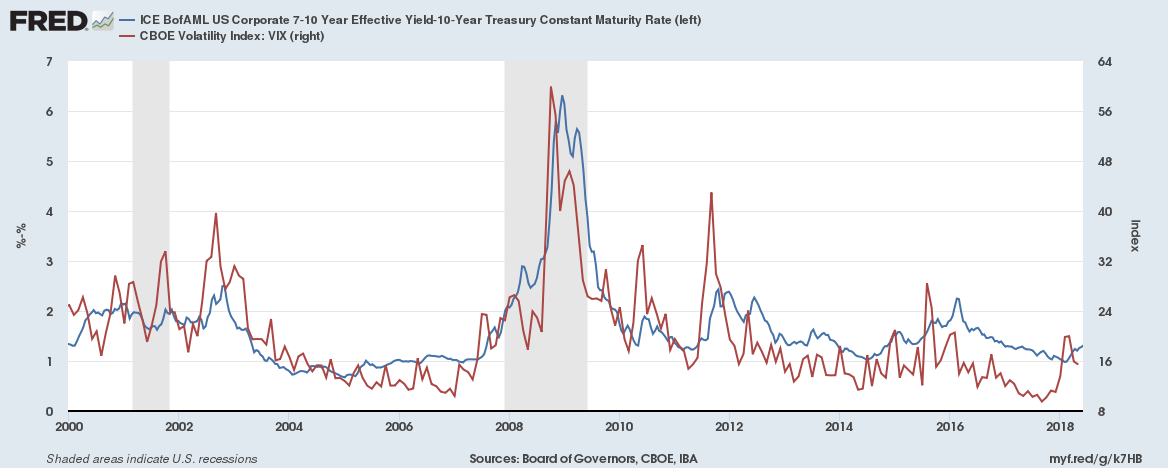
This same relationship can be seen in the time series below.
T+ Correlation Matrix
Given VIX’s correlation to corporate credit spreads, it is natural to examine whether this correlation translates to the T+ strategy being correlated to corporate bonds. As expected when back tested, the T+ hypothetical returns[v] have had a strong correlation to corporates and a low correlation to most other asset classes. Below is a chart of the quarterly correlations from January 2007 (Launch of the VIX options used by the T+ strategy) to March 2018.
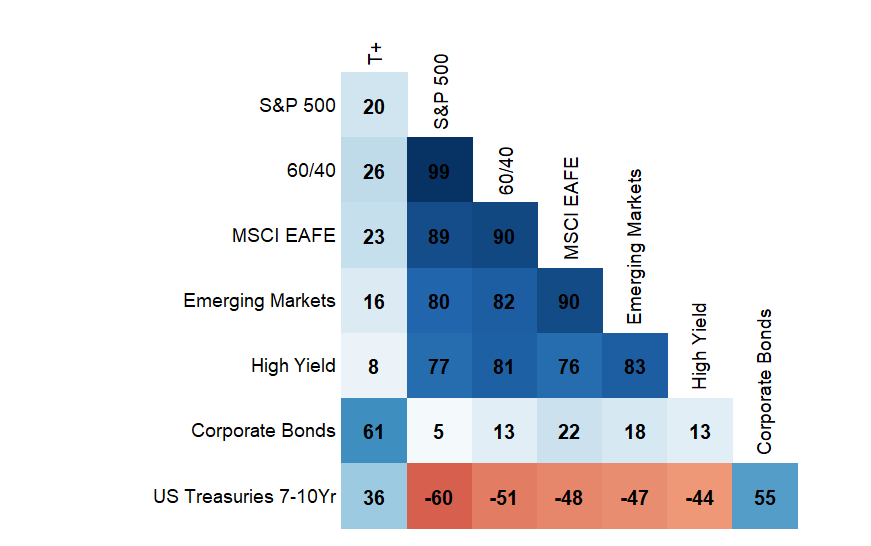
Cassini’s T+ strategy back test has a correlation of 0.61 to corporate bonds. Although T+ is correlated to corporate bonds through the credit spread, it also provides needed diversification to a corporate bond portfolio.
Principal Component Analysis
Principal Component Analysis (PCA) is a tool, used to determine the underlying driving factors across data sets with the goal of finding the signal in the noise.
In this case, there is a large shared signal (or principal component). There are two principal components between the corporate spread and VIX. The first principal component explains 85% of the movement of both corporate spreads and VIX. We can rationally think of this component as “macro risk.”
The rest of the variance between the two is idiosyncratic in nature, and is likely driven by the noise of smaller relative VIX movements that can occur without corporate spreads meaningfully changing. The noise of VIX makes the correlation examined above slightly lower than would be expected considering the very strong shared signal related to macro risk.
In the PCA output bellow, Comp. 1 explains 85% of the variance of both corporate spreads and VIX:
|
T+ Within a Diversified Portfolio
Examining the expected correlation of T+ to corporates is important from a portfolio construction point of view. The correlation is helpful as a guide for how to think about this unique and diversifying return stream.
When placing T+ within the landscape of a broader portfolio, it can be considered as either:
- A diversifying element to a broad fixed income allocation
- A way of shift risk away from equity towards fixed income
- A portfolio allocation displacing a portion of a corporate bond allocation
T+ can find a logical location in a portfolio while helping allocators feel confident in making a large enough allocation to make an impact.
Given T+’s lack of correlation to other asset classes and its attractive absolute and risk adjusted return, the strategy represents an attractive portfolio diversifier and return enhancer.
Relevance of the VIX to Corporate Spread Correlation
It is important to note that although the positive correlation between VIX and the corporate spread is helpful, this correlation is not crucial to the performance of Cassini’s T+ strategy. The T+ strategy is comprised of long VIX puts[vi] and 7-10 yr U.S. Treasuries[vii]. It is the inverse correlation between these two components that is key to the performance of T+.
To learn more about the inverse correlation between Treasuries and VIX puts, CLICK HERE.
[i]Equity Volatility: CBOE Volatility Index (^VIX)
[ii]Corporate Credit Spread: The corporate credit spread is calculated as ICE BofAML US Corporate 7-10-year Effective Yield minus 10-year Treasury constant maturity rate.
[iii]Volatility Securities: Represented by investments in Long VIX Index puts as determined by a proprietary algorithm. Cassini reserves the right to use other VIX futures traded products, such as but not limited to, The VelocityShares Daily Inverse VIX Medium-Term ETN (ZIV), or equity index option exchange traded products, such as but not limited to, WisdomTree CBOE S&P500 PutWriteStrat ETF (PUTW).
[iv]Corporate Bonds: Represented by an investment in iShares iBoxx $ Investment Grade Corporate Bond ETF (LQD).
[v]The Strategy’s hypothetical returns are comprised of a back-test of a representative strategy from January 1st 2007 to March 31st 2018. The hypothetical returns are presented for informational purposes only and do not represent achieved historical performance. The algorithms used to produce the hypothetical returns are not necessarily the algorithms that will be used to manage the Strategy in the future. Cassini reserves the right to adjust the strategy as needed. The hypothetical returns are presented in US dollars and reflect the hypothetical reinvestment of all dividends and interest, accrued income, realized and unrealized gains or losses, and are net of hypothetical investment management fees and net of hypothetical fees after transactions. Hypothetical returns are not net of custodial fees if applicable. The applicable management fee schedule is 0.95% annually, deducted quarterly in arrears. Actual fees may vary based on, among other factors, account size and custodial relationship. CCM’s advisory fees are fully detailed in its Form ADV Part 2A. Full monthly return capsule is available upon request.
[vi]VIX Puts: Represented by investments in Long VIX Index puts as determined by a proprietary algorithm. Cassini reserves the right to use other VIX futures traded products, such as but not limited to, The VelocityShares Daily Inverse VIX Medium-Term ETN (ZIV), or equity index option exchange traded products, such as but not limited to, WisdomTree CBOE S&P500 PutWriteStrat ETF (PUTW).
[vii]7-10 year U.S. Treasuries: Represented by an investment in iShares 7-10 Year Treasury Bond ETF (IEF) with reinvesting dividends.
Definitions:
“S&P 500” Represented by an investment in SPDR® S&P 500® ETF (SPY) with reinvesting dividends.
“60/40” Represented by an investment in Vanguard Balanced Index Fund Investor Shares (VBINX) with reinvesting dividends.
“MSCI EAFE” Represented by an investment in iShares MSCI EAFE ETF (EFA) with reinvesting dividends.
“Emerging Markets” Represented by an investment in iShares MSCI Emerging Markets ETF (EEM) with reinvesting dividends.
“High Yield” Represented by an investment in Vanguard High-Yield Corporate Fund Investor Shares (VWEHX) with reinvesting dividends.
“U.S. Treasuries” Represented by an investment in iShares 7-10 Year Treasury Bond ETF (IEF) with reinvesting dividends.
"Standard deviation" A measure of the dispersion of a set of data from its mean. It is calculated as the square root of variance by determining the variation between each data point relative to the mean.
Cassini Capital Management, LLC (CCM), is an investment adviser registered with the State of Florida; however, such registration does not imply a certain level of skill or training and no inference to the contrary should be made. Additional information regarding the Strategy, including investment management fees, as well as important information regarding CCM, its services, compensation, and conflicts of interest is contained in the firm’s Form ADV Part 2 and is available upon request or at www.adviserinfo.sec.gov. This presentation is not intended for the giving of investment advice to any single investor or group of investors and no investor should rely upon or make any investment decisions based solely upon its contents. The TPlus(T+) Strategy may not be suitable for all investors as the appropriateness of a particular investment or strategy will depend on an investor’s individual circumstances and objectives.
Limitations of Past Performance; Possibility of Losses: Past performance does not guarantee future performance. Participation in the Strategy carries the potential for profit as well as the probability of loss, especially over shorter time periods.
Other Fees and Expenses; Impact of Taxes: The investment management fee paid to CCM is separate and distinct from the internal fees and expenses charged by mutual funds and ETFs to their shareholders. These fees and expenses are described in each fund’s prospectus, and will generally include a management fee, internal investment, custodial, and other expenses, and a possible distribution fee. Prospective clients should consider all of these fees and charges when deciding whether to invest in the Strategy. Performance results for this strategy do not reflect the impact of taxes.
Comparative Benchmark Corporate Bonds (LQD) The iShares iBoxx $ Investment Grade Corporate Bond ETF seeks to track the investment results of the Markit iBoxx USD Liquid Investment Grade Index, composed of U.S. dollar-denominated, investment grade corporate bonds. Returns illustrated are net of fees.
Charts: All charts and graphs presented are property of Cassini Fund and were created for this presentation deck. Additional source material and statistical calculation details are available upon request.